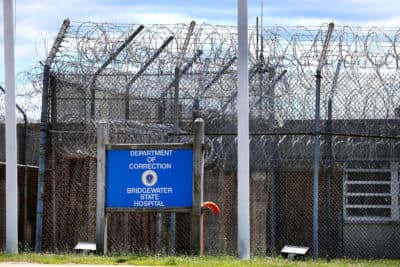
Mass. Taxpayers Foundation Responds To Critics On Health Reform Spending

(401k/Flickr)

By Michael J. Widmer
Guest Contributor

A new Massachusetts Taxpayers Foundation (MTF) study finds that in fiscal 2011, the state’s share of spending attributable to the 2006 health reform law was $453 million, or 1.4% of the $32 billion budget. And, when you look at the first five years of state spending for health reform, the annual increase, year-to-year, averaged about $91 million. In short, health reform hasn’t been a “budget-buster” as some critics have claimed. Pretty good news, right? Well, the Pioneer Institute‘s Josh Archambault and Amy Lischko aren’t so sure. While they largely accept the way MTF calculated the cost of health reform, they’ve applied some creative accounting to challenge the report’s conclusions.

A little background might be helpful: With our focus on the state budget, tax policy, and the Massachusetts economy, MTF’s engagement in health reform goes back many years. Prior to enactment of the 2006 law, we concluded that the state would have to increase spending by about $100 million a year to achieve the goal of nearly universal health insurance coverage. In 2008, with implementation well underway, some critics of the law began predicting “massive cost overruns” – up to $2 billion over ten years – with “back-breaking costs to the taxpayers.” So, in 2009, and again this year, MTF decided to take a look at the numbers and report on what was really going on. Specifically, we wanted to know how the health reform law was affecting state spending over time. Where has spending gone up because of the law and why; where has it gone down; what has been the net change year-over-year; and is it manageable in the context of the overall state spending?

Now, with the rate of uninsured in Massachusetts dipping below 2%, we have some answers. The amount Massachusetts spends to help low-income, uninsured residents gain access to needed health care has increased from $1.04 billion before the law was enacted to $1.95 billion after five years of reform. Since the federal government picks up approximately half the cost, the state’s share of the increase was $453 million. In separate blogs, Archambault and Lischko have raised a series of questions about how the spending figures should be interpreted. For instance, why didn’t MTF calculate the cumulative cost of reform and average that over five years? My answer is that, although the answers to their questions can be easily derived from the report’s detailed spending chart, they aren’t meaningful in the context of sound budget analysis.

Let me illustrate what I mean with an example: I’ve made a commitment to heat my home, so I have to buy heating oil. Let’s say that in 2010, my oil bill was $1,000, in 2011 it was $1,250, and in 2012 it rose to $1,600. In order to maintain my commitment to a heated house, I had to budget $600 more in 2012 than in 2010. In other words, on average, I’ve had to add $300 to my heating oil budget each year. With this knowledge, I can decide if my budget is manageable. The methodology suggested by Archambault and Lischko would have me add the difference between 2010 and 2011, which is $250, to the difference between 2010 and 2012, which is $600, for a total of $850. Divide by two years and you have an average of $425. As Lischko says in her blog, “Huh?”

The MTF analysis of increases and decreases due to the law is factual and transparent, and our calculation of the average annual change in state spending – $91 million – is a valid and accurate way to look at the budget impact. MTF has been doing this work for decades, and we’ve earned the trust of policymakers, politicians, and advocates representing many different viewpoints. We’ll stick to the basics and continue to provide sound, objective budget analysis.


Michael J. Widmer is President of the Massachusetts Taxpayers Foundation.

  • http://byrondennis.typepad.com/masshealthstats/ dennis byron

    Mr. Widmer is the creative accountant, not Josh and Amy. And he must have a creative PR person too. He says that to heat his house he had to add $250 to his base-year payment the second year and $600 to the base-year payment the third year.  He had no change from what he had before (i.e., a heated house) but two years later he is spending 60% more for it.  In the case of RomneyCare, the state government has the same thing it had before – its share of provider payment for the health care needs of the working poor — but five years later the state is spending almost 100% more for it.  And that’s after Mr. Widmer segregated RomneyCare’s effect on personal, municipal, and federal budgets from its effect on the state budget, something only a creative accountant would do. And that’s forgetting that the accountant in chief at the time — Romney — sold the idea on the basis that there would be no incremental cost at all… to anyone!Worse, the idea of using the words “$91 million” and coupling that number with the billion-dollar base spend in one quote was really a cynical PR ploy hoping the gullible or in-the-bag press would miss the words “per year,” “additional,” and “incremental” buried in the paragraph above Table 1 in the Blue Cross report. And it worked — here (http://www.wbur.org/2012/04/13/mass-health-budget – WBUR would not correct the omission when advised of it)– here (http://www.kaiserhealthnews.org/Daily-Reports/2012/April/13/state-health-roundup.aspx — note how Kaiser took the original WBUR story and made it sound like $91 million was the cumulative additional spend for all five years ), and — here(http://realitybasedbob.sayanythingblog.com/2012/04/16/massachusetts-taxpayers-foundation-mother-of-obama-care-doing-very-well-thank-you-very-much/  — just as an example of how the story was reported in the ultra-left wing blogosphere at sites such as ThinkProgress, etc.) Respectable, responsible media sites such as the Boston Globe and Public Consulting Group corrected their stories immediately when advised of the the “additional, incremental, per-year” wording in the sentence above Table 1 of the Blue Cross report. It appears the ultra left wing media was not only not going to make corrections but in the case of Kaiser wanted to double down on the misleading statistic.The Statehouse News Service, the New Bedford Times and others didn’t fall for the PR trick in the first place.

  • http://twitter.com/josharchambault Josh Archambault

    Mike, thanks for your reply. I
    guess we will agree to disagree on the emphasis of what numbers are the most
    important. As Amy mentioned in her post, we think it is vital to look at many
    different numbers to fully understand the cost of the reform law, including,
    but not limited to, the cumulative cost of reform, average annual cost
    of reform, the difference in costs pre vs. post reform, AND your annual average
    growth. They all tell an important, but slightly different part of the cost
    story.


    That said, I do want to offer
    another analogy for the way of thinking about this issue. When you have a child
    go off to college, are you as a parent only interested in the incremental cost
    increase of tuition year to year? Of course not. You want to know how much you
    are paying each year, and for budget purposes, how much more you are paying
    relative to pre-college years. I understand this is not standard budget
    practice for tracking public safety money or local aid, but it makes more sense
    when you start a new program as we did in 2006.


    Finally, I hope that we can agree
    that Pioneer’s research on the Massachusetts reform is not in the same camp as
    CATO’s, as you seem to imply in the post. CATO has been consistently opposed to
    the Massachusetts law before it passed in the General Court. By contrast, Pioneer
    has never taken a position on the reform, and we try to be a fair observer of
    the process and let the data speak. For this reason, we think it is important to
    be open and comprehensive when we tackle the data.